Wednesday, September 22, 2010

Lab #5: Data Sources and Management

I
1. What are some advantages and disadvantages of using digital spatial data? According to Bolstad, some advantages include that many features have already been mapped and converted to digital data; "many of the data help provide public services such as safety, helath, transportation, water, and energy. One disadvantage is that sometimes a person has to pay inorder to obtain some of these data.

2. What are the most important questions you must ask before using already-developed spatial data? Who collected the data and for what purposes.

3. How do DOQs differ from regular photographs? Digital Orthophoto Quadrangles are scanned photographic images that have been corrected for distortions due to camera tilt, terrain displacement, and other factors.

4. Three existing data sets:
c. Digital Flood Plain Data: Used to reduce physical and financial damage in case of floods; created   by The Federal Emergency Management Agency.

II.
2. a. What are the names of the feature datasets in the geodatabase?
        1. Basemap
        2. Hydrology

    b. What are the names of the feature classes in the hydrology dataset?
        1. NHDFlowline
        2. NHDPoint
        3. NHDWaterbody
        4. Watersheds

   c. For each one of the feature classes you just listed, describe whether it is a polygon, line or point layer.
       1. NHDFlowline: line
       2. NHDPoint: point
       3. NHDWaterbody: polygon
       4. Watersheds: polygon


3. a. Is topoq24.shp a raster or vector layer? Vector digital data.
    b. What is the GIS data format of topoq24.shpShapefile.
    c. Is there metadata associated with topoq24.shp? Yes.
    d. What is the GIS data format of the NHDFlowline layer? Personal Geodatabase Feature Class
    e. Is there metadata associated with NHDFlowline? Yes.
    f. What are 3 keywords used to describe the NHDFlowline layer? River, Hydrography, Stream.
   g. Who created the NHDFlowline layer? U.S. Geological Survey in cooperation with U.S.  Environmental Protection Agency, USDA Forest Service, and other Federal, State and local partners.


4. Is there still metadata associated with the layer? Yes.

6. 
In the USGS_QD_ID field, find the value that corresponds to the Canoga Park QUAD_NAME.    What is it? 34118-B5.  
a. The National Hydrologic Dataset: Contains digital spacial data about surface waters including rivers,  streams, canals, ditches, lakes, ponds, springs, and wells; produced by the Environmental Protection Agency.
b. The National Wetlands Inventory: contains location and condition of wetlands; produced by the US Fish and Wildlife Service.

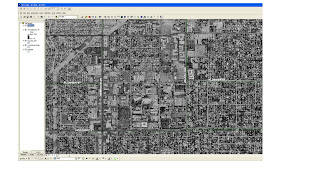
7. The DOQQ is black and white.

8.

10.


12. The layer is not showing up.

Tuesday, September 21, 2010

Lab #4: Working with Map Projections


Significance of Map Projections

Map projections are used to represent the surface of the earth. They are required for creating different types of maps. Because a dissected sphere cannot be evenly spread on a flat surface, all map projections distort the surface of the earth to some degree. Some distortions work for certain maps depending on the location the map is trying to portray. Map projections are used to most accurately portray the different properties of the planet earth. There are many types of map projections, the following are some examples: “Conformal” projections conserve angles and direction; “Equal-area” conserve area; and, “Equidistant” preserve distance but, distorts shape.

 Mercator and Stereographic maps are examples of “Conformal” projections. They preserve the shapes of small objects but distort the shape and size of larger objects. These maps are useful when a person wants to know where the countries or continents are in relation to eachother. It would not be smart however, to rely on these maps to determine the and size of a country or region. The Stereographic version makes the northern and southern most regions of the globe appear to be much bigger than they truly are. The distance from Washington D.C. to Bagdad, Iraq in the Mercator projection is: 8,420.751647 miles, and 5,949.659306 miles in Sterographic.

To represent “Equal-area” projections, I used Cylindrical and Bonne maps. They are useful when trying to determine the area of a landmass. Sinusoidal maps can be used for both "Equal-area" and "Equidistant" projections. Bonne maps have a heart-like shape. They are not very common but, they do the job. The distance from Washington D.C. to Bagdad, Iraq in the Sinusoidal map is: 6,679.755121 miles, and 6,067.505247 miles in the Bonne map. They are not exactly the same but, very close.

Finally, I used a CarrĂ©e and, again, a Sinusoidal map as examples of “Equidistant” projections. The Carree map, according to Wikipedia, “preserves distance from some standard point.” The Sinusoidal map almost has the shape of a diamond being the widest at the equator. In this map the equator is not distorted. The distance from Washington D.C. to Bagdad, Iraq in the Carree map is: 8,411.550068 miles, and 6,679.755121 miles in the Sinusoidal map.

As I mentioned, every map projection is distorted one way or another. Conformal projections work best when the aim is to show direction; “Equal-area” when trying to show area; and “Equidistant” when trying to preserve distance between two points in the map. In order to be as accurate as possible, it is very important to know what projection would work best with the information we are trying to depict.


Coordinate Systems & Projections Worksheet

1. An ellipsoid is "a sphere that was slightly flattened at the poles." It is widest at the poles and flat on the north and south.

2. A Geographic Coordinate Systme.

3. "The magnetic north is the point towards which a compass points. The geographic North Pole is located at one of the poles of the Earth's axis of rotation."

4. "A datum is a 3-dimentional frame of reference used to determine surface locations. It attempts to approximate the ellipsoid."

5. A map projection is used to transffer locations from the curved earth's surface onto a flat surface.

6. A developable surface is one that "can be obtained from a plane sheet by deformation, without stretching or shrinking."

7. The lines of langitude.

8. GRS80 is the best model of the earth for the North American region.

9. The State Plane Coordinate Systme is more appropriate to use for developing and analyzing spatial data when mapping counties or larger areas; It is dessigned for specific regions of the U.S. and, "each state contains state plane zones, boundaries of which usually follow county lines."

10. A "great circle distance" is the shortest distance between two points on the surface of the globe.


Wednesday, September 15, 2010

Lab #3: Data Formats & Models

1. Datat model: "a set of rules or constructs used to describe and represent aspects of the real world in a computer."

2. Topology is "the study of geometric properties that do not change when the forms are bent, streched or undergo similar geometric transformations."

3. A raster data model would be best to represent a hillside slope because the slope might not have a definite shape and a raster data model would better illustrate this.

4. In raster models each cell holds one value.

5. Four types of attribute data:
a. Nominal, groups of houses, parks, and cars.
b. Ordinal, groups of things that are hard, soft, softest.
c. Interval, the measurement of tmeperature.
d. Ratio, measurement of age in years.

6. Vector data file formats: shapefiles and coverages.

7. Raster data files: grids and images.

8. All of the following can be done with ArcCatalog except select features.

9. No, exercises in ch. 4 World.mdb does not contain a dataset, but it does contain three data classes.

10. Cities, countries, and disapp_area.

11. Shape file.

12. With both ArcCatalog and ArcMap opened, data can be draged from ArcCatalog to ArcMap. We can also create a new dataframe and on the TOC we can right-click on the layer that we want to paste on the new dataframe, select 'copy' and highlight "new data frame" and paste.

13. Number of records is 699.

14. On ArcCatalog select "disapp_area," on main screen click on "metadata" tab and click on attributes tab. The number of records should be listed there.


Wednesday, September 8, 2010

Lab #2: ArcGIS & ArcMap

1. Software products included in ArcGIS: ArcReader, ArcView, ArcEditor, and ArcInfo.

2.I think it's better to perform most data analysis and layer symbolization in data view because it is easier to focus on the actual data and not on the display.

3 Two ways to obtain help for ArcGIS Desktop are: By clicking on the "what is this" tool and by pressinon "shitf" + "F1."

4. Attributes are stored in tables that are linked to the features on a map. When an attribute is highlighted on a table, the featrue on the corresponding map highlightes at the same time, and vice versa.

5. The file extentsion of an ArcMap document is:  .mxd

6. Two ways to zoom in and out of a map are by using the "zoom in" "zoom out" tools on the tool bar and by right clicking the layer on the TOC and selecting the "zoom in to layer" option.

7. Three operations available in the 'context menu' of a layer are: open an attribute table; lable features; and zoom to layer.

8. If a check box next to a layer in the table of contents is grayed-out, it means that "the layer's visibility depends on the map's display scale." The issue can be resoved by zooming into the layer.

9. A large scale map covers a small area. Ex: a map of a house; a small scale map covers a relatively large area. Ex: a map of the United States of America."The larger the scale of a map the nearer the features are to their actual size.

10. Features are objects, they have shape and size, and is represented with a geometric shape; A surface is more like a grid, each square has a numeric value and it's used to represent things that have no distinct shape such as elevation or temperature.

11. A GIS does not create project criteria; the criteria is up to the individual.

12. The minimum elevation of the cities Earhart visited was 0 in New Orleans, USA; the maximum was 1045 in Tucson, USA. I determined these values by viewing the attributes table for the cities that Earhart visited and by right clicking on "ELEVATION" and selecting "Sort Ascending."

13. The approximate distance from Dakar to Assab is  4169.32 miles. This can be done by selecting the "Measure" tool on the tools menu, placing the crosshair on 1st location and dragging it to the 2nd location (double click to end the line and make sure the measuring units is in miles).

14. One can figure out the names of the cities shown on a map by selecting the "Elements" tool and moving cursor over a city, and by right clicking on the cities layer on the TOC and selecting "Lable Features."

15.

Wednesday, September 1, 2010

Lab #1b: GIS on the Web

What is GIS?:
1. "A geographic information system (GIS) integreates hardware, software, and data for capturing, managing, analyzing, and displaying all forms of geographically referenced information." 

2. "A geographic information system (GIS) is a computer software solution that enables managers to store, retrieve, and analyze data which are related to a particular location.
 http://foh.hhs./NYCU/EnvHealthGIS.asp

3. "A full definition of GI Science was provided in a report on a workshop held in January 1999 at the National Science Foundation, Geographic Information Science:" “Geographic Information Science (GIScience) is the basic research field that seeks to redefine geographic concepts and their use in the context of geographic information systems. GIScience also examines the impacts of GIS on individuals and society, and the influences of society on GIS. GIScience re-examines some of the most fundamental themes in traditional spatially oriented fields such as geography, cartography, and geodesy, while incorporating more recent developments in cognitive and information science. It also overlaps with and draws from more specialized research fields such as computer science, statistics, mathematics, and psychology, and contributes to progress in those fields. It supports research in political science and anthropology, and draws on those fields in studies of geographic information and society.” (Mark, 2000)
http://www.geog.buffalo.edu/~dmark/MARK_GISCI_BOOK.PDF

According to these definitions, GIS can stand for geographic information systems or geographical information science. Both definitions for geographical information systems include a source of technology used to gather data about space or a location that can be saved and accessed for various purposes. The definition for geographic information science is more broad, it includes geographic informatin systems and their impact on societies. Also included are the various fields that use geographic information science.

It seems as though, the definition for GIS changes slightly depending on who is using the system or science and for what purposes.

'REAL WORLD' USES OF GIS:
1.GIS can be used to design maps of borders between territories, topography of a land scape or infrastructure.

2. It can be used by mining companies to locate areas rich in specific minerals.  http://www.gisdevelopment.net/application/geology/mineral/index.htm

3. GIS can also be used by different businesses to map out the demographics of communities and make decisions about what locations would provide them the greatest profits.
http://www.esri.com/industries/retail/index.html

MAPS & GIS DIFFERENCES AND SIMILARITIES:
Maps-- can be drawn by hand; no specific materials are necessary to produce a map; anybody can create a map in any part of the world.

GIS-- is a technology; a person must be able to afford the technology necessary; GIS can be used to collect, store, and modify data.

Similarities-- both can be used to provide information about a specific location, to create a guide, and they both can be used by people to explore the environment and take advantage of available resources.